Analyses & Checks
Built-In Analyses & Checks for Reliable, Decision-Grade Data
Built-In Analyses & Checks for Reliable, Decision-Grade Data
Built-In Analyses & Checks for Reliable, Decision-Grade Data


Key Figures
Key Figures
40+
Automated Controls
40+
Automated Controls
40+
Automated Controls
50+
Out-of-the-box reports
delivered through comprehensive analysis dashboard
50+
Out-of-the-box reports
delivered through comprehensive analysis dashboard
50+
Out-of-the-box reports
delivered through comprehensive analysis dashboard
Uncertainty Management
based on standards
Uncertainty Management
based on standards
Uncertainty Management
based on standards
Key Features
Key Features
Pre-Built Dashboards to Detect, Refine, and Improve
Ready-to-use dashboards help you instantly spot data gaps, inconsistencies, and outliers — without needing to build custom reports.
Support quick sanity checks, contributor feedback loops, and prioritization of areas to refine in the next collection cycle.
Turn every collection into a learning loop — continuously increasing the precision and reliability of your sustainability data.

Automated Data Validation at Scale
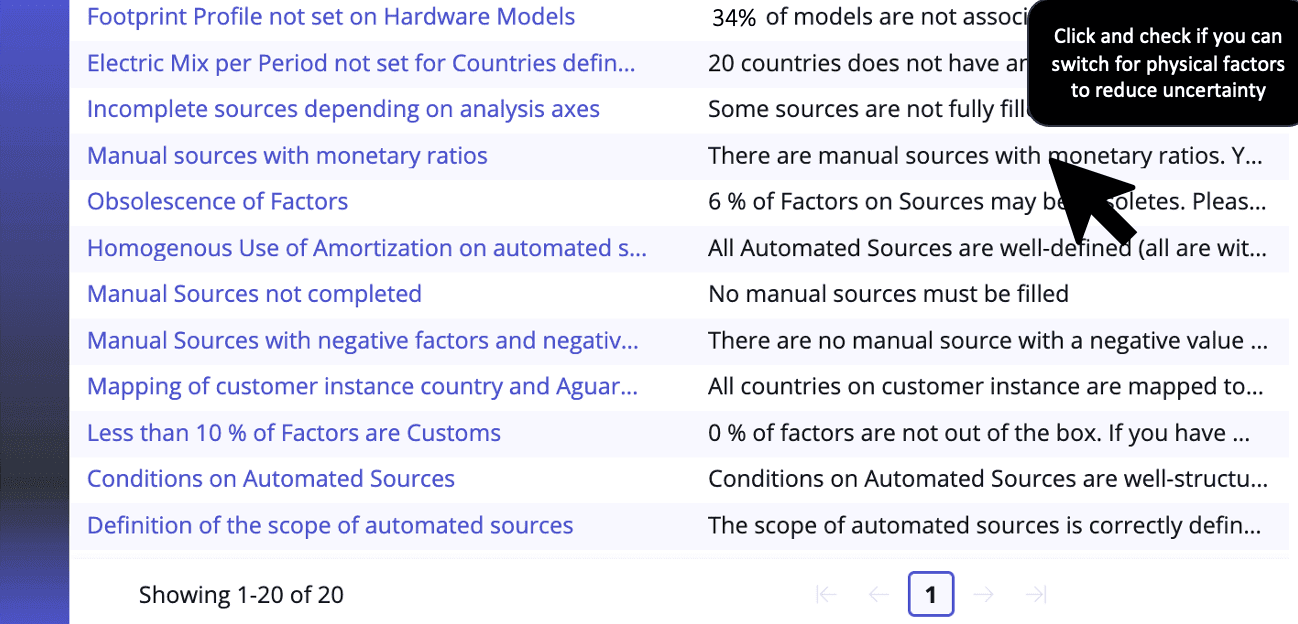
The platform runs real-time consistency checks across all input sources — flagging missing values, outdated emission factors, incorrect electricity mixes, or anomalous entries.
These controls ensure your data is clean and compliant before it even reaches the reporting layer.
No more chasing errors downstream or second-guessing your metrics.

Dynamic Uncertainty Management & Ratio Analysis
Built-in tools quantify data uncertainty and highlight where it might affect result accuracy — both qualitatively and quantitatively.
Advanced ratio analytics (e.g., CO₂e per user or per € spent) help identify anomalies and benchmark across time, teams, or locations.
This empowers teams to prioritize action where it matters most and communicate findings with confidence.

"It dramatically simplifies the calculation and reporting processes at various scales of the organization"
Sylvain Baudoin
Product Owner

"It dramatically simplifies the calculation and reporting processes at various scales of the organization"
Sylvain Baudoin
Product Owner

"It dramatically simplifies the calculation and reporting processes at various scales of the organization"
Sylvain Baudoin
Product Owner
Testimonials
Testimonials
Testimonials
Customer Stories
Customer Stories
Discover how our customer leverage from our solution
Discover how our customer leverage from our solution
Discover how our customer leverage from our solution
You could also be interested in
You could also be interested in

Capabilities
Instantly know how & where to act
Smart Recommendations
See more

Capabilities
Instantly know how & where to act
Smart Recommendations
See more

Capabilities
Instantly know how & where to act
Smart Recommendations
See more

Capabilities
One-Click Reports Built for Auditors and Stakeholders
Audit-ready report
See more

Capabilities
One-Click Reports Built for Auditors and Stakeholders
Audit-ready report
See more

Capabilities
One-Click Reports Built for Auditors and Stakeholders
Audit-ready report
See more
Ready to sow the seed of change?
Think of our solution as a Saguaro seed — full of potential, just waiting for you to nurture and grow it. And because your field is unlike any other, book a demo to explore how it can take root in your context — and how quickly and easily you can spike your impact.

Ready to sow the seed of change?
Think of our solution as a Saguaro seed — full of potential, just waiting for you to nurture and grow it. And because your field is unlike any other, book a demo to explore how it can take root in your context — and how quickly and easily you can spike your impact.

Ready to sow the seed of change?
Think of our solution as a Saguaro seed — full of potential, just waiting for you to nurture and grow it. And because your field is unlike any other, book a demo to explore how it can take root in your context — and how quickly and easily you can spike your impact.


