Get meaningful footprint for better decision-making & stakeholders involvement
Get meaningful footprint for better decision-making & stakeholders involvement
Get meaningful footprint for better decision-making & stakeholders involvement
Whether it's shared resources, reconstitute who's responsible and for what.
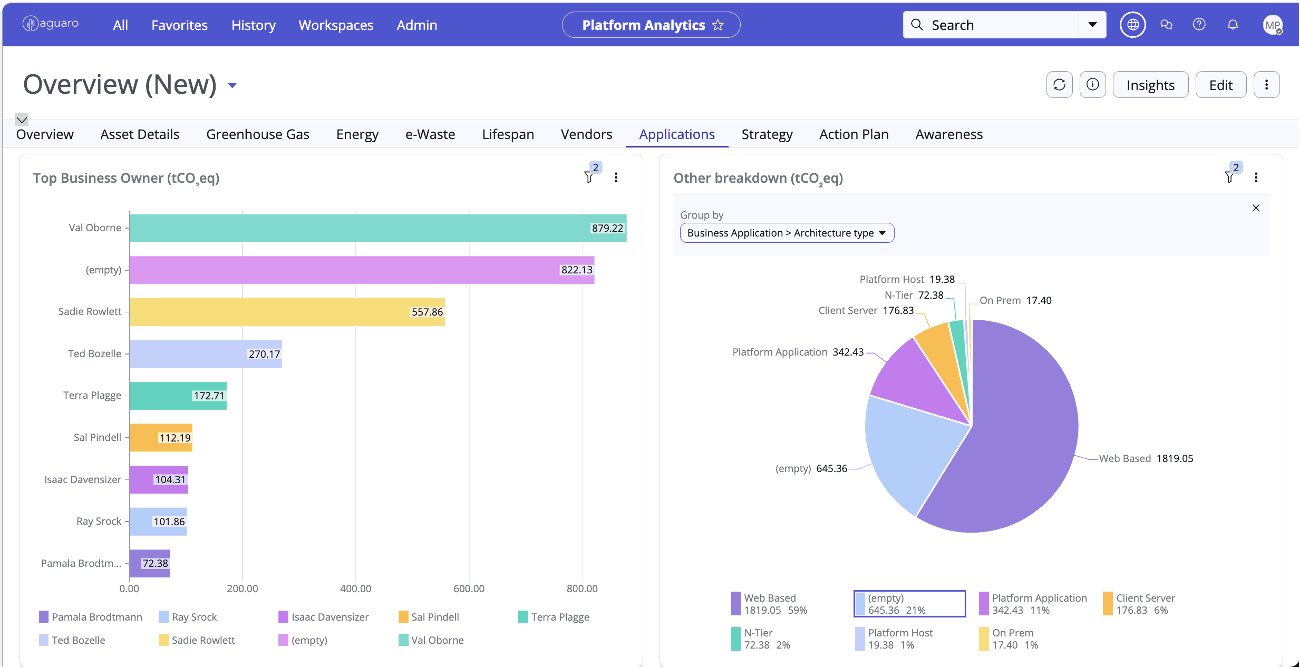
Leverage flexible allocation engine inspired by activity-based costing to distribute environmental impacts across shared systems and hybrid infrastructures.
Help to reconstitute footprint per shared services, application, customers etc.
This enables fair, transparent footprint attribution and removes blind spots in complex value chains.
Whether it's shared resources, reconstitute who's responsible and for what.
Leverage flexible allocation engine inspired by activity-based costing to distribute environmental impacts across shared systems and hybrid infrastructures.
Help to reconstitute footprint per shared services, application, customers etc.
This enables fair, transparent footprint attribution and removes blind spots in complex value chains.
"If we don’t have a granular level at the level of applications or workloads, we don’t know how to make decisions."
Hervé Guirado
VP Technical Debt
Testimonials
Customer Stories
Customer Stories
Discover how our customer leverage from our solution
Discover how our customer leverage from our solution
Think of our solution as a Saguaro seed - full of potential, just waiting for you to nurture and grow it. And because your field is unlike any other, book a demo to explore how it can take root in your context - and how quickly and easily you can spike your impact.
Think of our solution as a Saguaro seed - full of potential, just waiting for you to nurture and grow it. And because your field is unlike any other, book a demo to explore how it can take root in your context - and how quickly and easily you can spike your impact.
Think of our solution as a Saguaro seed - full of potential, just waiting for you to nurture and grow it. And because your field is unlike any other, book a demo to explore how it can take root in your context - and how quickly and easily you can spike your impact.